Recently I have discovered that GitHub markdown seamlessly supports Sequence Diagrams and it is awesome!
What are these words you may ask? I thought I’d make a short post about that.
First and foremost GitHub is a place where Knights Province code lives. You may have already seen public Knights Province resources there. There is an Issues list that holds the bugs and improvement ideas for the game (link). There’s also dynamic scripting Wiki (link).
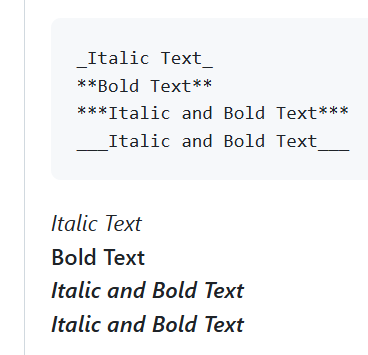
Markdown is a set of special terse text format rules that allow for a number of formatting styles and features. Starting from simple ones that make text look bold (with asterisks), or italic (with underscores). Most of the modern Web platforms support it to a different extent. Unfortunately it is not standardized, but usually the basics work the same. More sophisticated expressions allow to generate tables or style whole sections of text as a programming language with syntax highlight:
Sequence Diagrams are a nice way of presenting sequences of events happening over time in a graphical form between several entities. Here is a short example of how a phone conversation may look like in this notation:
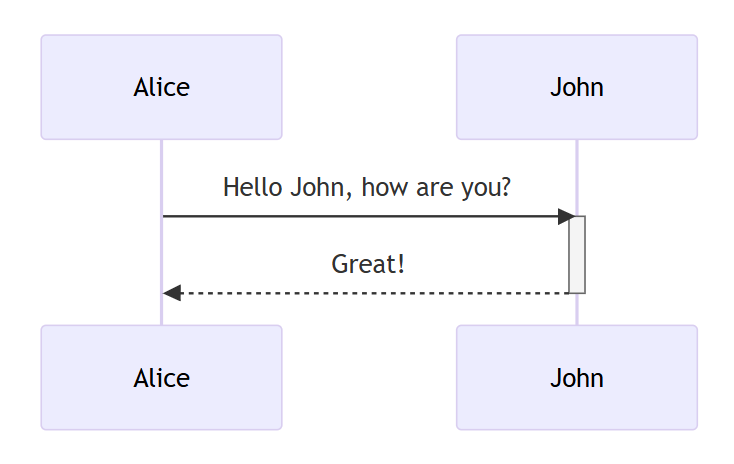
I won’t bore you here with details about Sequence Diagrams rules, just the basics. Actors are listed on top and repeated on bottom. Diagrams are read from top to bottom. Arrows denote control flow. Thick sections on actor verticals mean some processing is going on.
And there is a fourth piece to this puzzle – Mermaid. It is a certain diagram generation library that was seamlessly incorporated into the GitHub markdown processing. It supports a number of diagram styles, but we are interested in the Sequence Diagrams, since this is what Knights Province needs at the moment. If the text will have certain magic words in it spelled in the right order, they will transform into a picture:
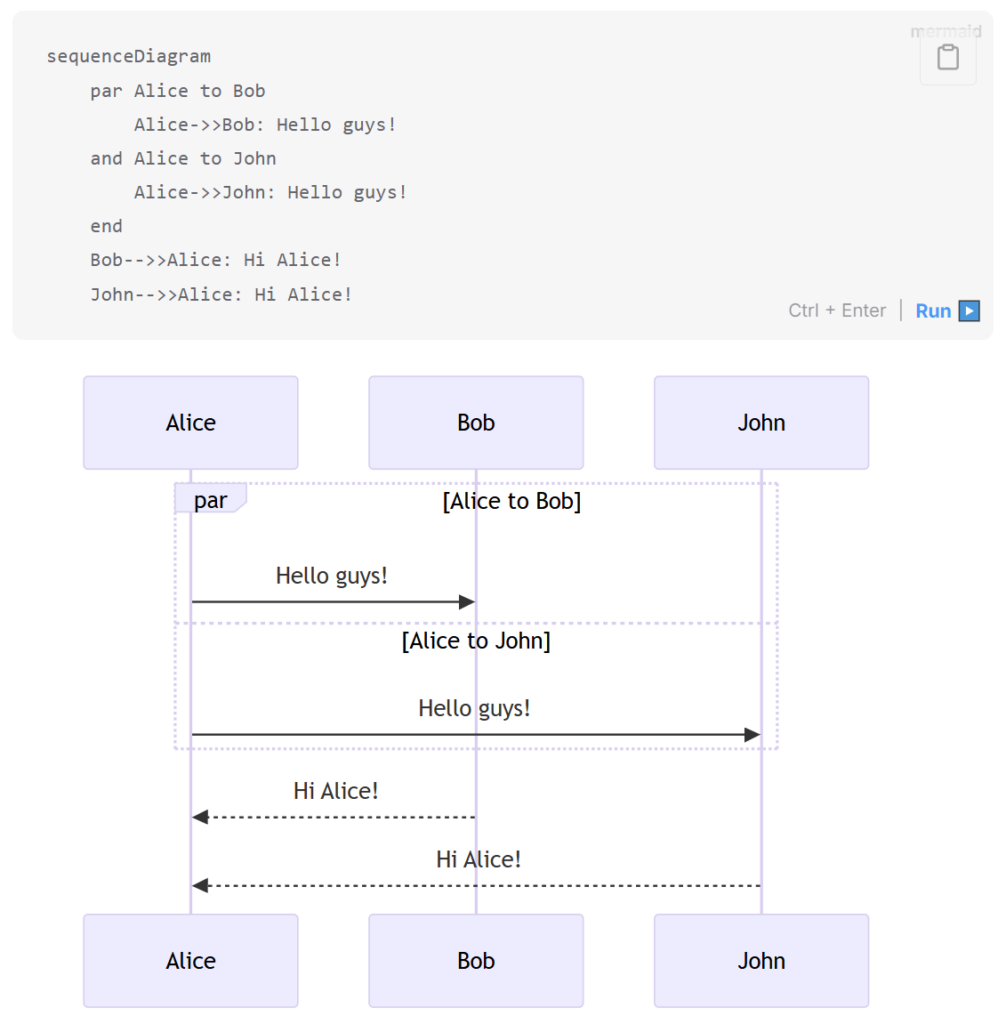
Sweet thing about it is that the “code” for the diagram is in simple text form and is very short. Those 8 lines fully describe the diagram.
Lately I have been working on bringing Knights Province Multiplayer up to shape. In the past few months a lot has been improved and changed for a better gameplay and UI experience in the networking and multiplayer code. For example the players roster has changed, but that’s a different story, maybe for another post.
Networking code is quite different from the rest of the game though. It is riddled with asynchronous (non-immediate) events and their handling between separate entities located hundreds of milliseconds apart – players, host and servers. Those data exchanges and states form up quite a complex and intricate shape. Now, Sequence Diagrams are ideal for showing those interconnections and events relations. Having the things laid out on paper (yes, I even printed some of them) is a huge help in figuring out weak spots and places for improvements.
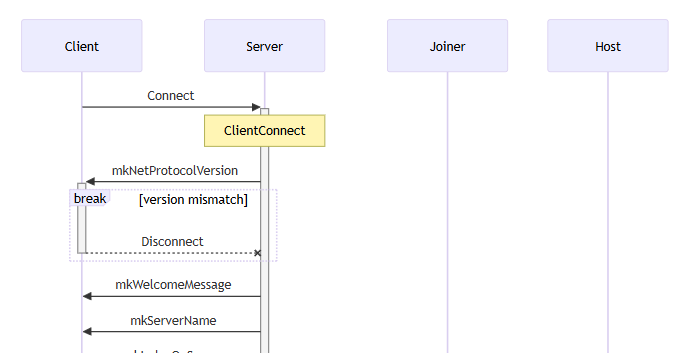
So, here is a sample diagram visualizing how a new client may enter a multiplayer room, get his role (become a Host or a Joiner) and get to setting up the upcoming game:
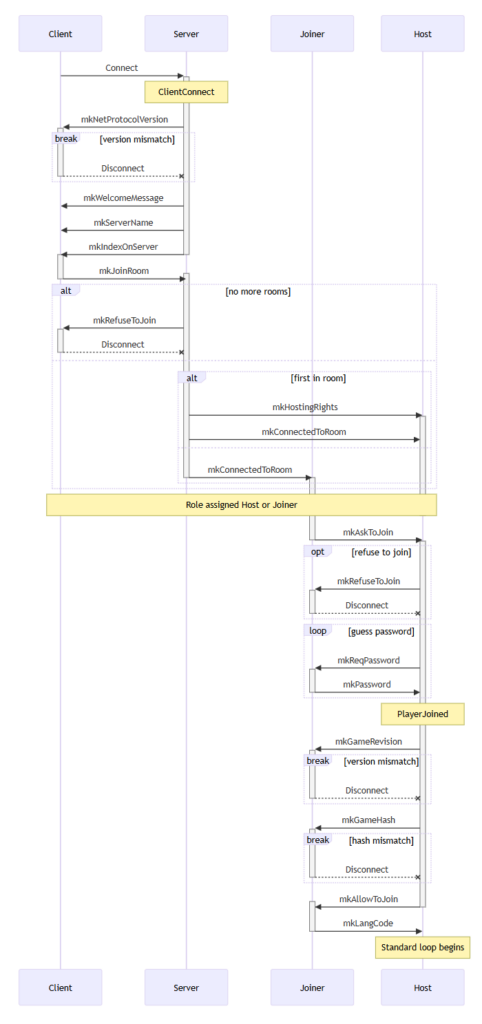
Simple as that! 🙂